

How is Covid Affecting the Real Estate Market?
.jpg?w=128&h=128)
Jessica Evans
For Jessica Evans, real estate is more than a job — it’s a way of life...
For Jessica Evans, real estate is more than a job — it’s a way of life...
Predictable and consistent are not words that we would use to describe the DC area real estate market in the first half of 2020 due in part to the Covid pandemic and it’s impact on the economy, buyer and seller mindsets, and stay at home orders. It's been understandably difficult to keep track of what is happening and where things stand with our housing market, as it has had its own unique trajectory relative to national trends. In this post, I’ll start with a brief summary of what we saw earlier in the year, and then finish up with where we are now.
The data in this post can be found in the Bright MLS Weekly Market Trends Report and the Bright MLS June Market Report. The general market data is from the area that Bright MLS covers which includes DC, Delaware, Maryland, New Jersey, Pennsylvania, Virginia, and West Virginia.
Pre-Covid: January - Early March 2020
2020 started off similar to 2019 with the typical seasonality that we see from year to year. Inventory levels were low in January after the slower holiday listing season, and buyer demand was steadily increasing each week as we moved into February and March.
During the first few months of 2020, interest rates were historically low, averaging between 3.5%- 3.75% which encouraged homeowners to refinance and increased the purchasing power for buyers. At this time, there was no prediction that rates would be declining significantly.
Early Covid: Mid March - End of April 2020
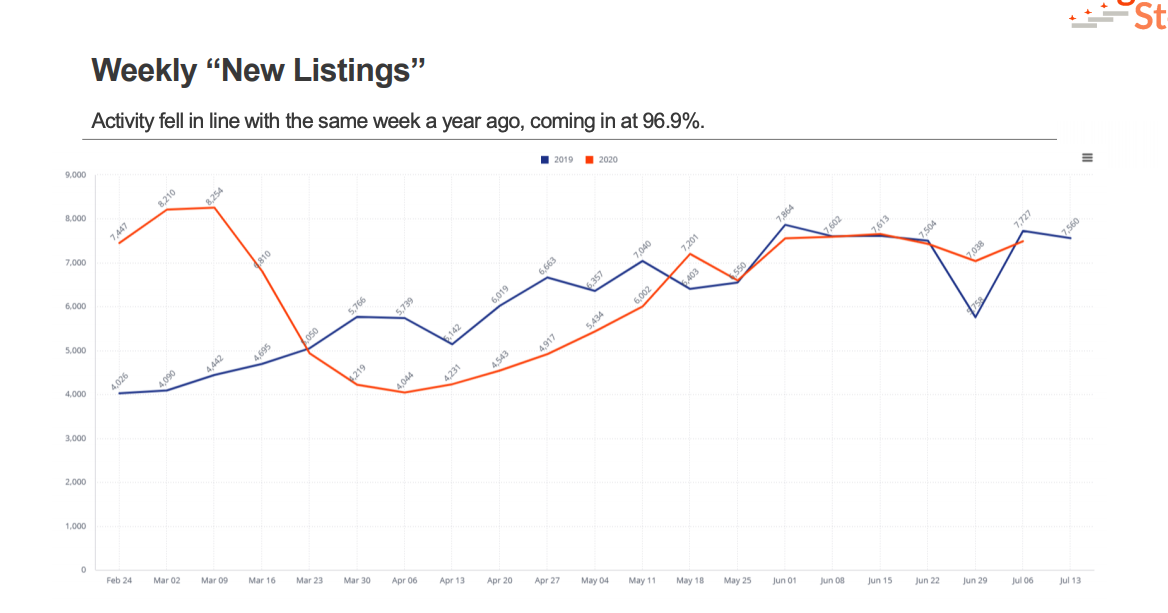
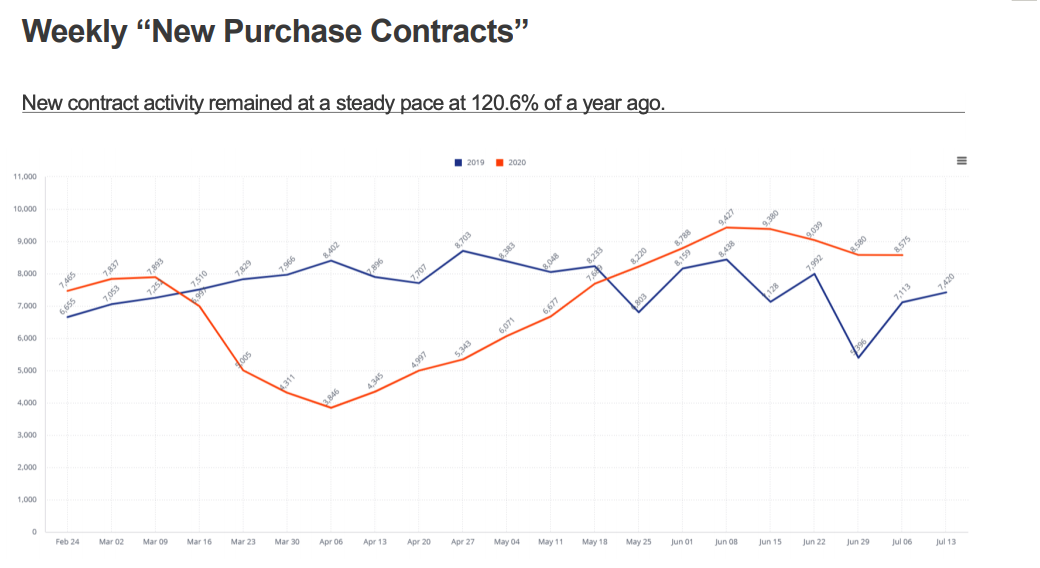
During the 2 weeks between March 9th and March 23rd the market quickly reversed directions. New listings declined by 38%, and new purchase contracts fell by a similar amount.
Closings spiked briefly at the end of March as buyers and sellers shortened their timelines and rushed to close as quickly as possible due to unknowns about whether or not settlements would be possible as stay at home orders were issued.
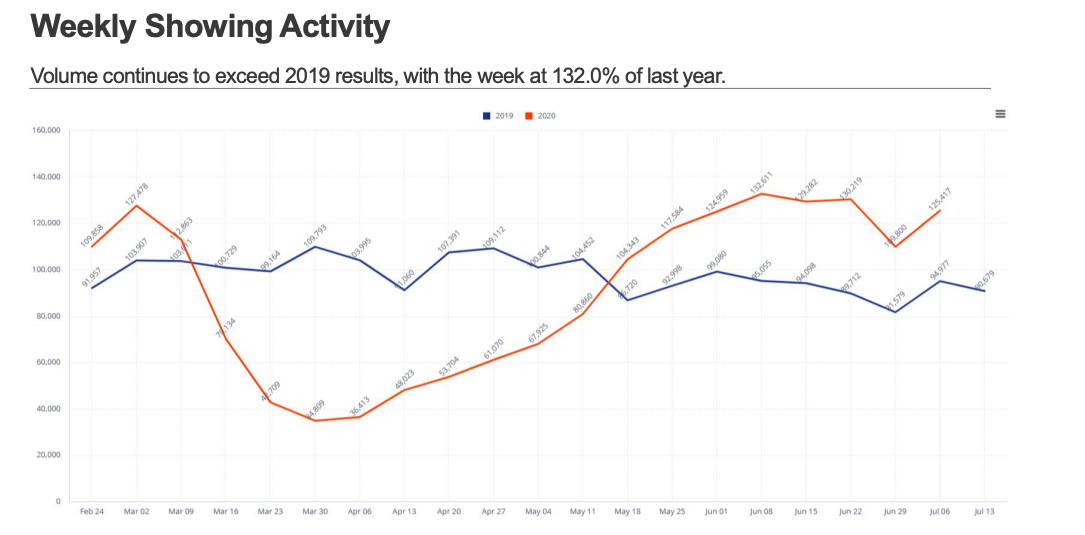
Showing activity fell by 60% as buyers decided to pause their in-person searches and sellers opted for virtual showings or took their homes off of the market.
With bleak economic forecasts, there was much speculation that the housing market may be in for a sharp decline. For more on why this economic downturn is very different from the housing market crash of 2008, check out this post.
Covid Recovery: April - May 2020
The lowest level of real estate activity occurred around April 6th with new listings, purchase contracts, and closings at their lowest levels for the year.
From there, each week saw steadily increasing market activity, although new listings, contracts, and closings remained below 2019 levels.
By this point, it was clear that real estate transactions would continue to be able to take place with the necessary logistics being permitted by local jurisdictions (except for PA) including appraisals, settlements, deed recording, etc. This removed some uncertainty and removed a potential obstacle for buyers and sellers.
Where we are now: Mid May - Today
Between May 11th and May 18th, showing activity, new purchase contracts and new listings surpassed 2019 levels for the first time since early March. This was a welcome milestone and one that took place earlier than predicted.
Since then, showing activity has remained well above 2019 levels along with new purchase contracts.
New listings have not exceeded 2019 levels and have not kept pace with higher buyer demand as evidenced by showing activity and new purchase contracts. Closed sales remain lower than 2019 levels due in part to lack of inventory for purchasers.
June 2020 DC Metro Market Activity
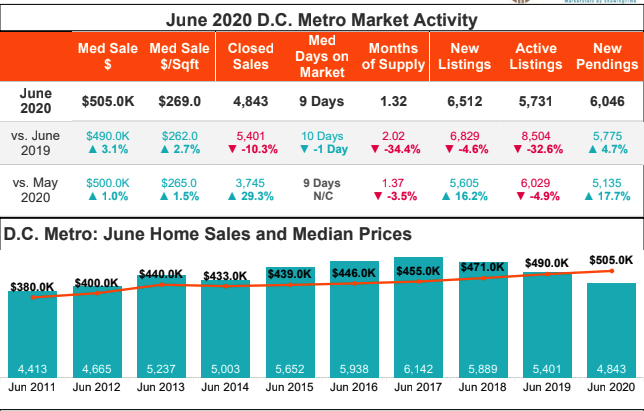
June 2019 vs June 2020
💰Median sales price increased 3.1% to $505k
📉Closed sales decreased 10.3% to 5,401
❗️Months of supply decreased 34.4% to 1.32
⚠️New listings are down 4.6%
✳️Active listings are down 32.6%
What does this mean?
There are 32.6% fewer homes on the market this June vs last June - buyers are competing with more other buyers for fewer homes
These market conditions will cause prices to continue to increase, and inventory levels to remain low.
An increase in listings (ie. more sellers deciding to sell their homes) or a decrease in buyer demand could create a more balanced market, however the timing of either of these is challenging to predict.
Why did prices increase instead of decrease?
Home prices are a direct result of supply and demand. When supply and demand are balanced, home prices remain stable. When demand exceeds supply, prices increase.
While buyer demand decreased in the early months of Covid, supply decreased by similar amounts with fewer sellers listing their homes for sale or taking them off of the market.
We did not see a significant Covid related increase in homes being listed for sale, whether due to loss of employment or income, or rental income.
My thoughts and personal opinion on what the future holds
Current market conditions will continue through the summer and into the fall with high buyer demand and low inventory as interest rates should remain low during this time, provided we don’t have a sharp increase in Covid and reinstatement of stay at home orders.
Sellers who also need to purchase will need to feel confident that they can find a house to purchase in a timely manner, or will need to find the home that they want to purchase before they will list their homes for sale. With low levels of new construction, the challenges of low inventory heavily impact our market which relies on resale.
We could see an increase in distressed properties entering the market in areas where homeowners have seen job losses and loss of employment. As we have seen, the Covid pandemic has disproportionately impacted specific sectors of our economy and its workers.
I predict that there will be a shifts in buyer preferences for the long term but I think it is hard to say exactly what these will be and to what degree.
I expect prices year over year to end up 5-10% above 2019 levels, particularly in areas with predominantly single-family homes or townhomes. Overall sales volume for the year will end up 10% or more below 2019 sales volume.
The impact that Covid has on the timing of buyers and sellers decisions will continue to decrease over time.
We’re grateful that the DC area housing market has remained strong during an otherwise challenging economic period. As we hope for continued decreases in Covid cases and continued health of our clients, neighbors and communities, we encourage everyone to do their part to stay safe and keep wearing those masks!
Curious about what your home is worth?
We can help with that!